Financial Data
Click below to see the latest financial information.
IR LibraryFinancial Data
(As of December 31, 2025)
Main P/L, B/S and Cashflow Indicators
| Results | |||||
| Unit | 27th FP (ended December 2021) |
28th FP (ended December 2022) |
29th FP (ended March 2024) |
30th FP (ended March 2025) |
|
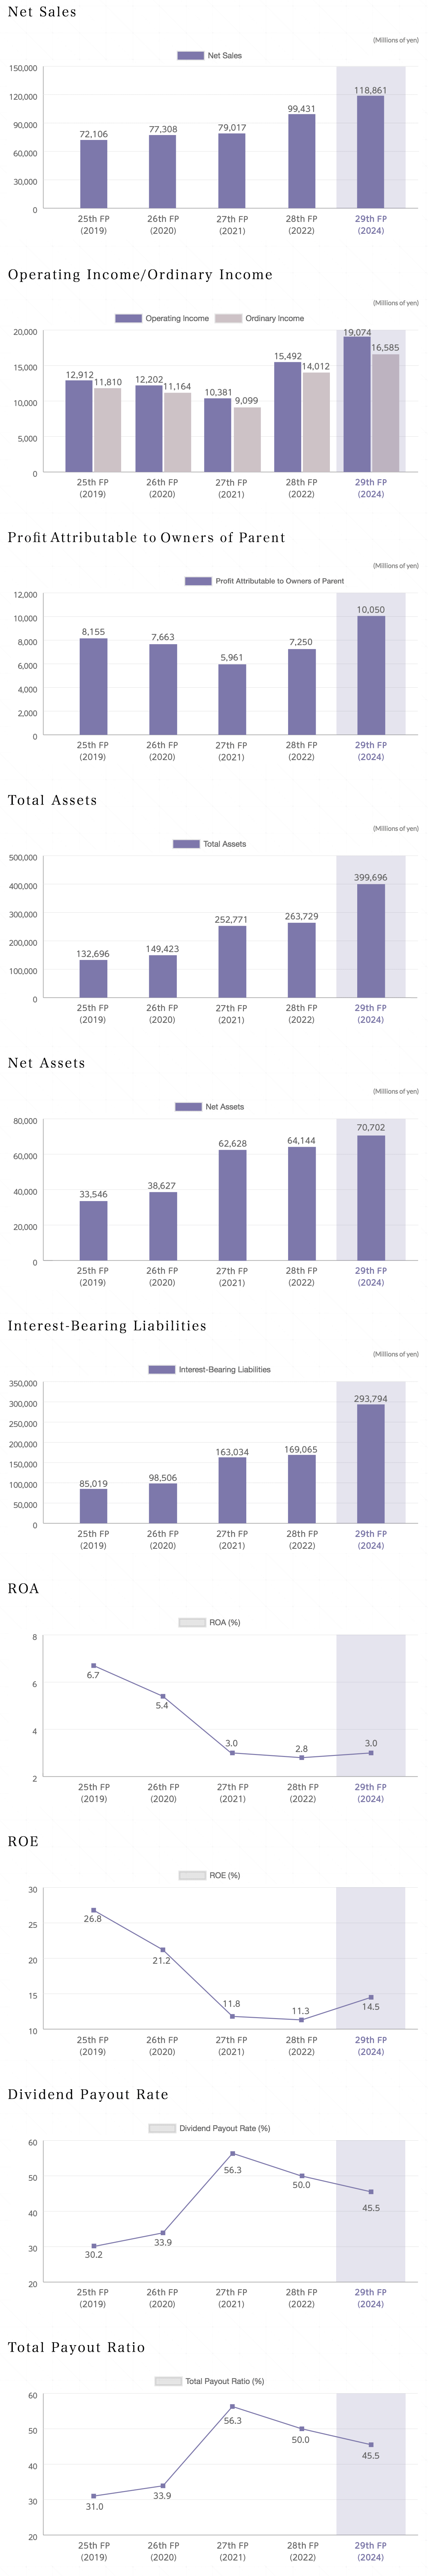
| Net Sales | Millions of yen | 79,017 | 99,431 | 118,861 | 113,603 |
| Operating income | Millions of yen | 10,381 | 15,492 | 19,074 | 21,311 |
| Ordinary income | Millions of yen | 9,099 | 14,012 | 16,585 | 17,320 |
| Profit attributable to owners of parent | Millions of yen | 5,961 | 7,250 | 10,050 | 11,193 |
| Total assets | Millions of yen | 252,771 | 263,729 | 399,696 | 459,847 |
| Net assets | Millions of yen | 62,628 | 64,144 | 70,702 | 78,681 |
| Cashflow from operating activities | Millions of yen | -10,810 | 1,501 | -68,892 | -24,765 |
| Cashflow from investing activities | Millions of yen | -29,721 | -1,620 | -32,611 | -17,293 |
| Cashflow from financing activities | Millions of yen | 50,293 | 2,144 | 114,585 | 39,469 |
| Cash and cash equivalents at end of period | Millions of yen | 33,559 | 35,604 | 48,712 | 46,050 |
Main Management Indicators
| Results | |||||
| Unit | 27th FP (ended December 2021) |
28th FP (ended December 2022) |
29th FP (ended March 2024) |
30th FP (ended March 2025) |
|
| Interest-bearing liabilities | Millions of yen | 163,034 | 169,065 | 293,794 | 336,394 |
| Liquidity | Millions of yen | 33,667 | 35,721 | 48,910 | 46,802 |
| Interest receivable | Millions of yen | 10 | 1 | 4 | 29 |
| Interest expenses | Millions of yen | 1,463 | 1,895 | 2,650 | 3,685 |
| Equity ratio | (%) | 24.8 | 25.0 | 18.1 | 17.2 |
| ROA | (%) | 3.0 | 2.8 | 3.0 | 2.6 |
| ROE | (%) | 11.8 | 11.3 | 14.5 | 14.8 |
| Number of employees | (People) | 334 | 398 | 442 | 475 |
| Net assets per share * | (Yen) | 657.50 | 691.87 | 759.56 | 827.19 |
| Profit per share * | (Yen) | 67.48 | 76.04 | 105.44 | 117.18 |
| Dividend payout rate | (%) | 56.3 | 50.0 | 45.5 | 41.0 |
| Total payout ratio * | (%) | 56.3 | 50.0 | 45.5 | 41.0 |
*We executed a shareholder allotment of subscription rights to shares based on a rights offering (non-commitment/gratis allotment of listed subscription rights) on May 26, 2013. New shares are issued upon exercise of these subscription rights to shares. Because the exercise price of the subscription rights is lower than the market price, based on paragraph 16 of the Guidance on Accounting Standards for Profit per Share (Guidance on Accounting Standards No. 4 issued on March 25, 2011), the number of shares equivalent to the share split caused by the issue of new shares dating back to the beginning of the previous consolidated fiscal year is adjusted to calculate net assets per share.
*Total payout ratio: (paid dividend total + acquired treasury stock total) ÷profit