Business Plan
1. Background to Long-Term Vision 2030 and 5th Medium-Term Management Plan
ES-CON JAPAN established the 5th Medium-Term Management Plan (FY3/25 to FY3/27) as Phase I toward the realization of the Long-Term Vision 2030, which lays out what kind of company it wants to be by FY2030 and the direction it is aiming for.
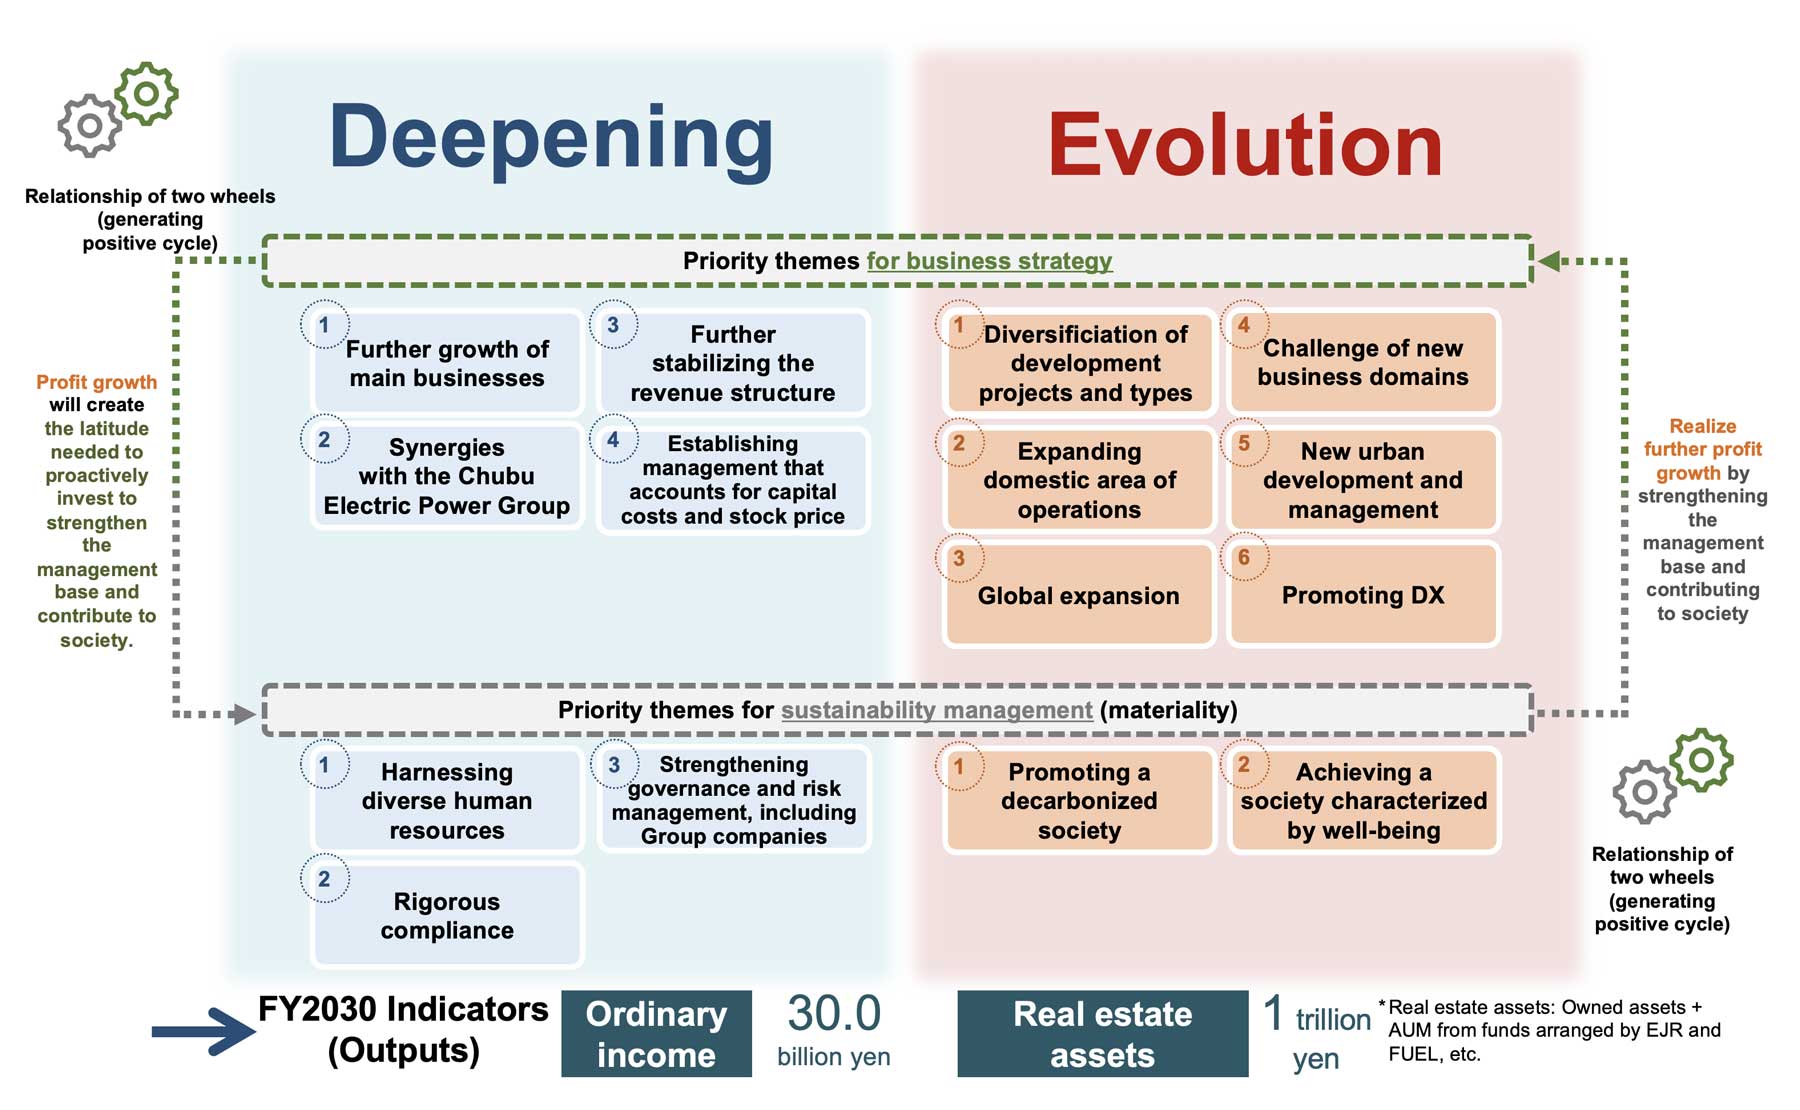
2. Overview of Long-Term Vision 2030
Target Direction
3. Overview of 5th Medium-Term Management Plan
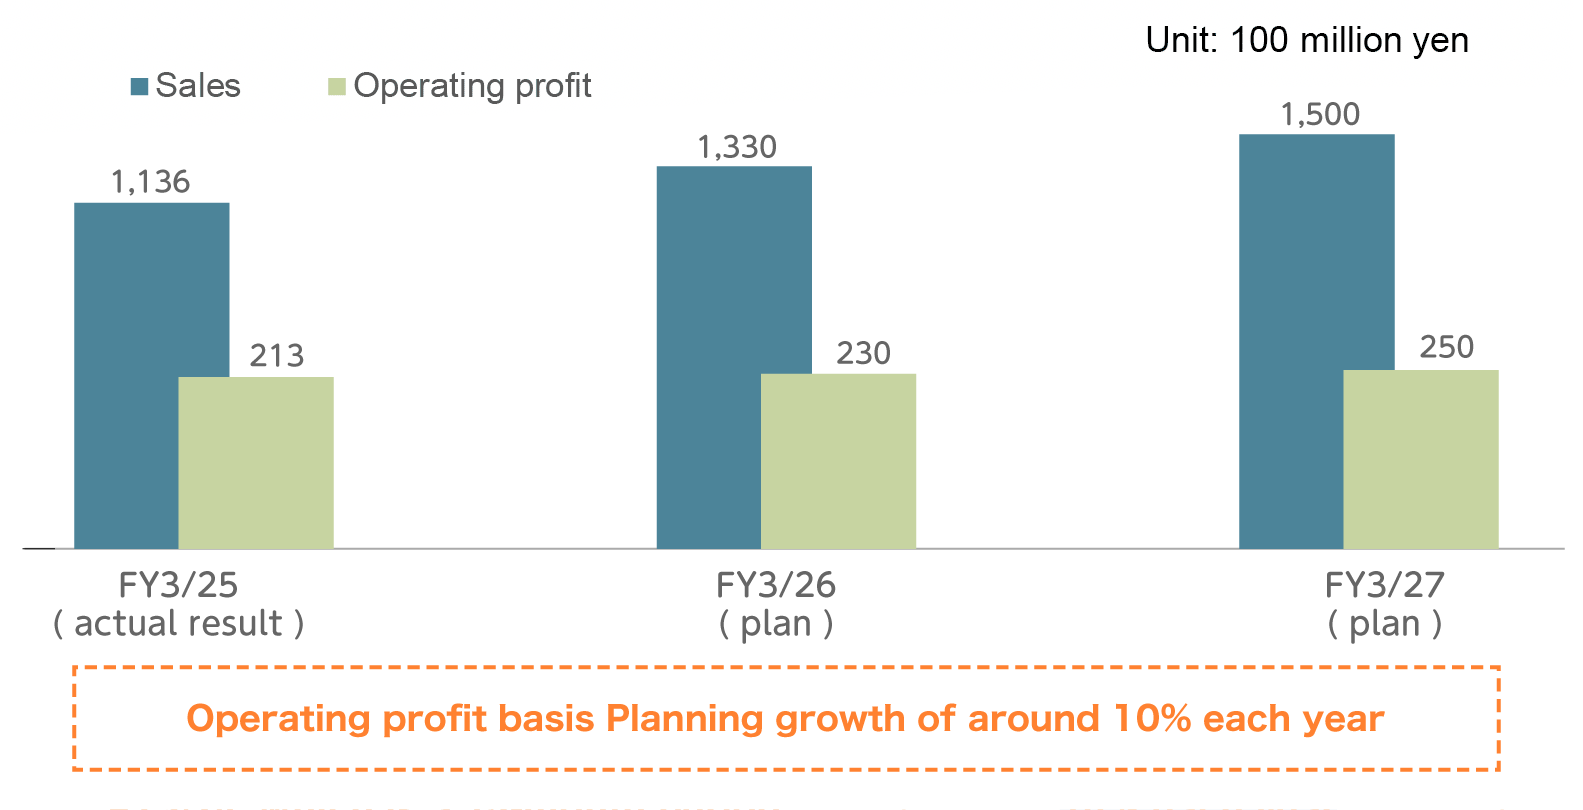
(1) Financial results plan
Unit: 100 million yen
|
Fiscal year ending Mar. 2025 |
Fiscal year ending Mar. 2026 |
Fiscal year ending Mar. 2027 |
||||||
| Actual result | Plan | Change | Rate of change | Revised plan | Initial plan | Revised plan | Initial plan | |
| Sales | 1,136 | 1,180 | -43 | -3.7% | 1,330 | 1,330 | 1,500 | 1,570 |
| Operating profit | 213 | 180 | 33 | 18.4% | 230 | 200 | 250 | 220 |
(2) Investment plan
Unit: 100 million yen
| Fifth Medium-term Management Plan | |||||||||
| Fiscal year ending Mar. 2025 |
Fiscal year ending Mar. 2026 |
Fiscal year ending Mar. 2027 |
Three-year cumulative total | ||||||
| Actual result | Plan | Change | Revised plan | Initial plan | Revised plan | Initial plan | |||
| Gross investment total | 720 | 610 | 110 | 660 | 770 | 1,120 | 1,120 | 2,500 | |
| Condominium development | 161 | 200 | -39 | 200 | 200 | 250 | 250 | 611 | |
| Revenuegenerating property development | 427 | 200 | 227 | 200 | 300 | 500 | 500 | 1,127 | |
| Acquisition of revenue-generating properties in operation | 78 | 150 | -72 | 200 | 200 | 300 | 300 | 578 | |
| Overseas investment | 54 | 50 | 4 | 60 | 60 | 60 | 60 | 174 | |
| Other | 0 | 10 | -10 | 0 | 10 | 10 | 10 | 10 | |
| Recoupment | 220 | 284 | -64 | 325 | 308 | 400 | 417 | 945 | |
| Amount recouped from revenuegenerating properties | 84 | 121 | -37 | 144 | 142 | 277 | 242 | 505 | |
| Net investment | 500 | 326 | 174 | 335 | 462 | 720 | 703 | 1,555 | |
(3) Management indicators
|
Fiscal year ending Mar. 2025 |
Fiscal year ending Mar. 2026 |
Fiscal year ending Mar. 2027 |
|||
| Actual result | Increase/decrease (%) | Increase/decrease (%) | Plan | Plan | |
| Stock revenue ratio | 26.2% | 30.4% | -4.2% | 28.2% | 30.0% |
| Stock revenue / general and administrative expence corverage ratio(cash basis) | 115.2% | 119.0% | -3.8% | 114.2% | 116.8% |
| Equity ratio | 17.2% | 17.5% | -0.3% | 17.6% | 17.5% |
| ROE | 14.8% | 13.4% | 1.4% | 13.9% | 14.0% |
| ROIC | 3.5% | 3.4% | 0.1% | 3.5% | 3.6% |
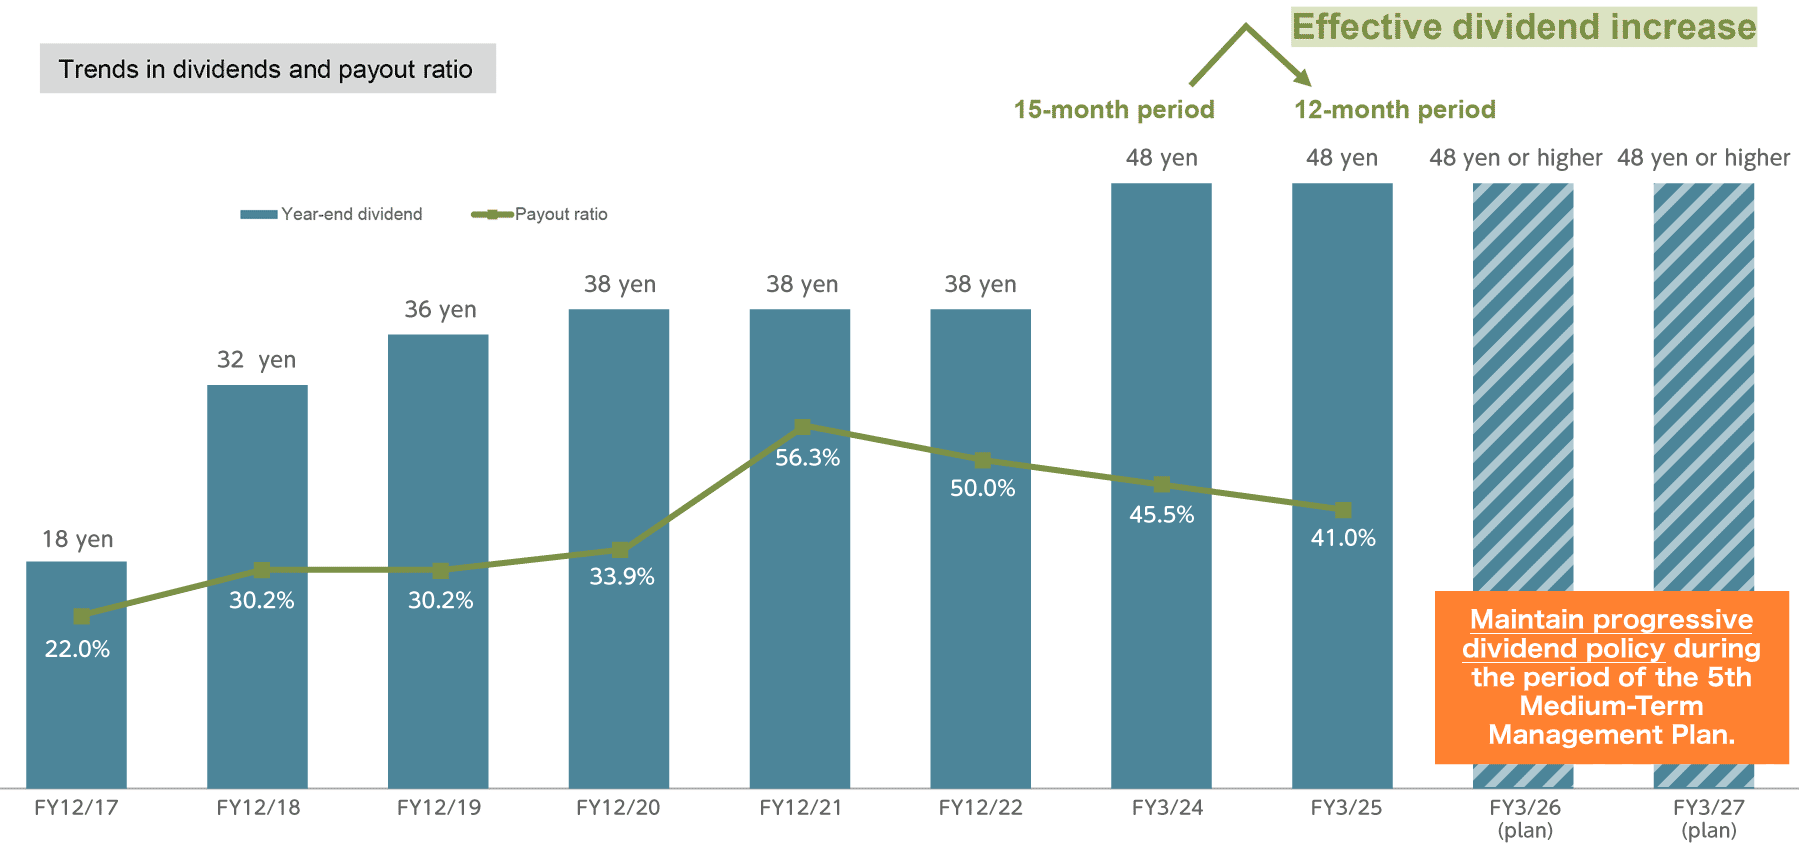
(4) Dividend policy
Maintain progressive dividend policy
Make the previous year’s dividend per share (DPS) the lower limit of DPS, and, in principle, maintain a dividend policy whereby dividends are progressively raised each year and never lowered.